Representing Data
Stem and Leaf Diagram
Used to display a simple list
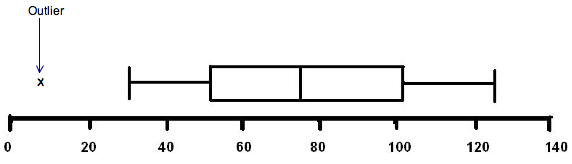
Box Plot
Outlier
An outlier is a value that is so out of trend it is not considered a true representation of the data
The outliers are 1.5 x IQR above Q3 or 1.5 x IQR below Q1
The outliers are 1.5 x IQR above Q3 or 1.5 x IQR below Q1
Histogram
The histogram gives a general shape for the data.
Is used instead of a bar chart as a a bar chart can't used grouped data with differing class widths
Is used instead of a bar chart as a a bar chart can't used grouped data with differing class widths
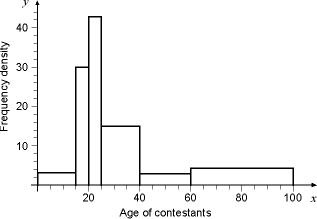
frequency = frequency density
class width
The area of the bars gives the frequency
class width
The area of the bars gives the frequency
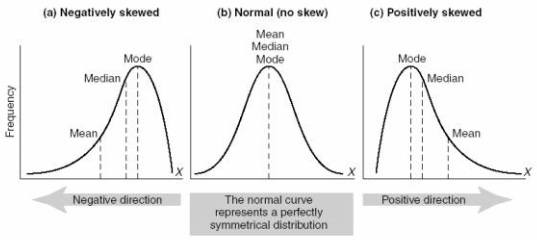
Skewness
In box plots and histograms the correlation can't be discussed (that comes in correlation)
Instead the skewness of the data is discussed
Instead the skewness of the data is discussed
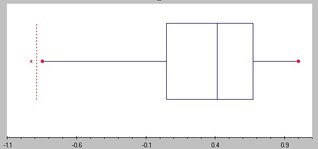
negatively skewed box plot
In an exam they'll give you a equation that works out the skewness coefficient.
E.g. 3(mean - median)
standard deviation
If the value is positive then it's a positive skew
If the value is around 0 then it's a normal distribution
If the value is negative then it's a negative skew
You may get asked to give further explanation to your skewness coefficient.
For this say
(if a positive skew) The mean > median > mode
(if normal distribution) The mean = median = mode
(if a negative skew) The mean < median < mode
This may be worth four marks
Comparing
When comparing two sets of data use common sense.
Compare the:
Use whatever data you are given or have worked out
Compare the:
- skewness
- range
- averages
- IQR
- standard deviation
Use whatever data you are given or have worked out
