Representing Data
Types of Data
Qualitative Data
Quantitative Data
Continuous Data
Data that can take any value within a given range
Data that has distinct and separate values
- Eye Colour
- Blood Group
- Gender
Quantitative Data
- Numeric Values
Continuous Data
Data that can take any value within a given range
- Height
- Weight
- Time
Data that has distinct and separate values
- Lottery numbers
- Amount of Money
- Number of TV episodes
Representing Data
Data Line
E.g. 10, 20, 20, 20, 23, 25, 30, 31, 54
n = 9
What you did at GCSE
Mode = 20
Mean = Σx = 25.89 2 d.p.
n
Median (Q2) = 23
Q2 position = n = 4.5 so 5th position
2 count to 5th position which is 23
Frequency Table
E.g.
E.g. 10, 20, 20, 20, 23, 25, 30, 31, 54
n = 9
What you did at GCSE
Mode = 20
Mean = Σx = 25.89 2 d.p.
n
Median (Q2) = 23
Q2 position = n = 4.5 so 5th position
2 count to 5th position which is 23
Frequency Table
E.g.
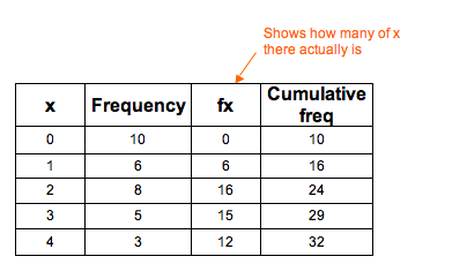
Mode = 0
Mean = Σfx = 49 = 1.53 2 d.p.
Σf 32
Median = 1.5
Q2 position = 32/2 = 16 want in between 16th and 17th - median means 50% data on either side
Use cumulative frequency and 16 and 17 are in different x values so:
1 + 2 = 1.5
2
Mean = Σfx = 49 = 1.53 2 d.p.
Σf 32
Median = 1.5
Q2 position = 32/2 = 16 want in between 16th and 17th - median means 50% data on either side
Use cumulative frequency and 16 and 17 are in different x values so:
1 + 2 = 1.5
2
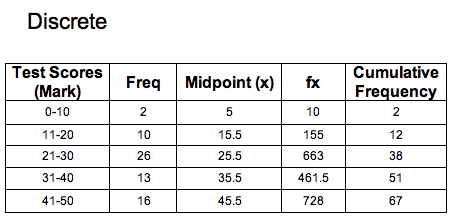
Grouped Frequency Table
E.g. beware of difference in discrete and continuous data here
E.g. beware of difference in discrete and continuous data here
|
As the values are discrete the Lower bounds and upper bounds of the groups are the integers put down The midpoint is the (LB + UB) 2 |
Mode = 21-30
Mean = Σfx = 2017.5 = 30.1 3 s.f.
Σf 67
Medianis done via linear interpolationexplained lower
Mean = Σfx = 2017.5 = 30.1 3 s.f.
Σf 67
Medianis done via linear interpolationexplained lower
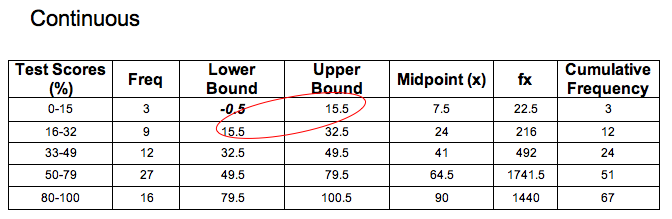
|
As the values are Continuous the Lower and Upper bounds are 0.5 higher or lower than the integers mentioned. Class width is UB - LB |
Mode = 50-79
Mean = Σfx = 3912 = 58.4 3 s.f.
Σf 67
Median is done via linear interpolation explained lower
Mean = Σfx = 3912 = 58.4 3 s.f.
Σf 67
Median is done via linear interpolation explained lower
Linear Interpolation
In grouped data there is no way of telling what the median value is exactly . And as there isn't a data line we can't tell exactly. Linear interpolation provides a best guess at the median
Class width x (Q2 pos - previous cumulative freq) + LB
Frequency of group
Frequency of group
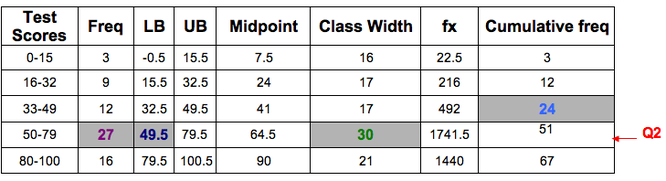
Q2 position = 34th position
30 x (34 - 24) + 49.5 = 60.61 2 d.p.
27
30 x (34 - 24) + 49.5 = 60.61 2 d.p.
27
Coding
Coding enables large numbers to be simplified
y = x - a
b
where a and b are constants and y is the coded value and x is the original value
When working oiut means with coded data. This is the y value - put this equal to the code equation and you get the real mean
E.g.
y = x -100
mean of coded is 30
30 = x -100
x = 130
mean = 130
y = x - a
b
where a and b are constants and y is the coded value and x is the original value
When working oiut means with coded data. This is the y value - put this equal to the code equation and you get the real mean
E.g.
y = x -100
mean of coded is 30
30 = x -100
x = 130
mean = 130
