Normal Distribution
Before you start: Drawing a diagram for each step helps you see what you are doing
In normal distribution mean, median and mode are the same and the data is symmetrical
In normal distribution mean, median and mode are the same and the data is symmetrical
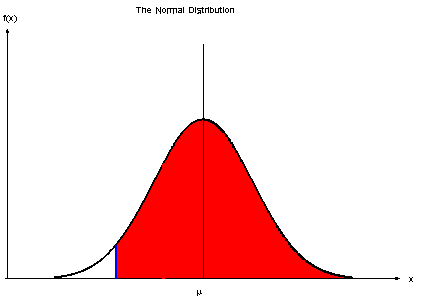
Normally distributed data
No matter what set of numbers there are, if the data is normally distributed it will take the form of the graph above
The data for the distribution is given in relation to the normal 'N' (The central line)
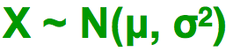
X - Random variable
N - Normal
~ - Distributed
μ - Mean
σ - Standard deviation
N - Normal
~ - Distributed
μ - Mean
σ - Standard deviation
How is this data used in probability?
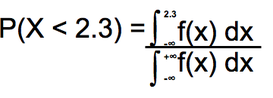
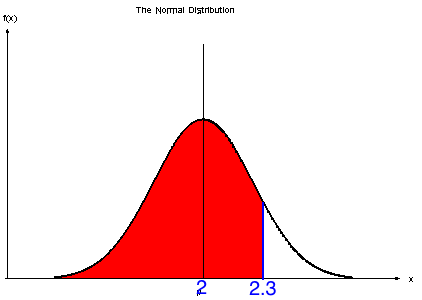
The above is not used but it shows that the probability can be viewed by the area below the graph
P(X < 2.3) is represented in the red area
|

|
Variable Z
The variable Z has a set of probabilities pre-set for it's values when Z ~ N(0, 1)
These values are that big list of z and p values at the back of the S1 part of the formula book
This means you have to be able to move the X values to the Z values
As the graph's are the same shape the probability is exactly the same
To move from one to the other:
These values are that big list of z and p values at the back of the S1 part of the formula book
This means you have to be able to move the X values to the Z values
As the graph's are the same shape the probability is exactly the same
To move from one to the other:

E.g.
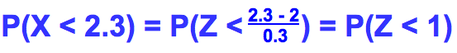
After referring to the table putting 1 in as a z value we find:
P(Z < 1) = 0.8413
P(X < 2.3) = 0.8413
P(Z < 1) = 0.8413
P(X < 2.3) = 0.8413
Using Probability with the Graph
Remember that the probability under the whole graph is always 1
So if P(X < 2.3) = 0.8413
Then P(X > 2.3) = 0.1587
So if P(X < 2.3) = 0.8413
Then P(X > 2.3) = 0.1587
P(X < 2.3)
|
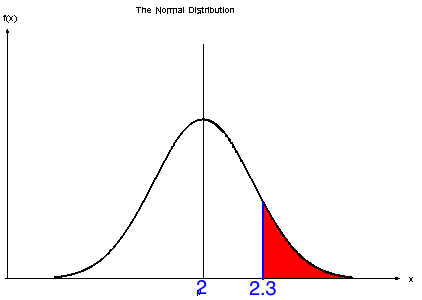
P(X > 2.3)
|
Using the Symmetry of the Graph
As the graph is perfectly symmetrical then this means you can manipulate the data to suit the Z values in the table
The table only gives P(Z < z) and values on the right hand side of the normal
E.g.
X ~ N(25, 16)
Remember σ = 4
Find P(X < 23)
P(Z < -1/2)
The table only gives P(Z < z) and values on the right hand side of the normal
E.g.
X ~ N(25, 16)
Remember σ = 4
Find P(X < 23)
P(Z < -1/2)
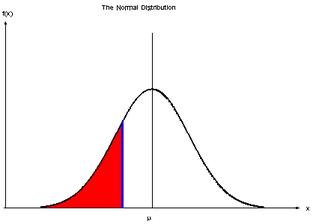
As it's on the wrong side flip it round
P(Z < -1/2) = P(Z > 1/2)
P(Z < -1/2) = P(Z > 1/2)
This is on the wrong side however.
As we saw above you need to turn this round
P(Z > 1/2) = 1 - P(Z < 1/2)
In the end we find
P(Z < 1/2) = 0.6915
meaning:
P(Z > 1/2) = 0.3085
meaning:
P(Z < -1/2) = 0.3085
hence:
P(X < 23) = 0.3085
As we saw above you need to turn this round
P(Z > 1/2) = 1 - P(Z < 1/2)
In the end we find
P(Z < 1/2) = 0.6915
meaning:
P(Z > 1/2) = 0.3085
meaning:
P(Z < -1/2) = 0.3085
hence:
P(X < 23) = 0.3085
Finding the mean or standard deviation
You may be asked to find the mean or standard deviation
In answering this you'll be given the probability, standard deviation and the z value
E.g.
P(X < 2.3) = 0.7123 with standard deviation of 0.4
Hence
In answering this you'll be given the probability, standard deviation and the z value
E.g.
P(X < 2.3) = 0.7123 with standard deviation of 0.4
Hence
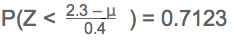
Using the table in the formula book 0.7123 requires a z value of 0.56
So:
2.3 - μ = 0.56
0.4
μ = 2.3 - 0.224
μ = 2.006
So:
2.3 - μ = 0.56
0.4
μ = 2.3 - 0.224
μ = 2.006
Percentage Points
There are exact probabilities you should use to get a special 4 decimal z value
They are represented on the formula booklet for P(Z > z) (not like the other table of P(Z < z) )
They are represented on the formula booklet for P(Z > z) (not like the other table of P(Z < z) )
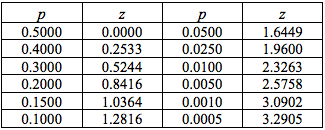
If you get these exact values you must use this table
You'll know when to use them as a percentage is used in the question generally
Remember though that they are going the wrong way with there probabilities
On this table P(Z > z) = 0.0500 means:
You'll know when to use them as a percentage is used in the question generally
Remember though that they are going the wrong way with there probabilities
On this table P(Z > z) = 0.0500 means: